Introduction
Everyone has taken a picture at some point. You stand somewhere, looking at the city: people scurrying, cars crawling, someone honking, someone parallel parking poorly. Just your usual dynamic mess. You press the button - and you seem to have captured a moment.
But in reality, it's just a frozen slice of movement. The photo is a pause. The city is a process that continues. Even if you print it on canvas, it won't become static: it keeps changing every second; traffic jams grow, someone blocked the road again, business as usual.
It's the same with digital systems. As long as the code sits on the disk, it's a perfect museum exhibit. No dependencies, no bugs, the GC is asleep, services aren't running away. Beauty, tranquility, and stasis. But just starting the program is enough - and the usual, programmed life begins. The system wakes up, shuffles state from one memory bucket to another, picks up latency, drops a couple of packets, tosses in some tail latency just because it can. All standard, nothing new.
We can strictly and succinctly define a dynamic system as one that:
- Has a state,
- Has time (even if discrete - tick-tack, CPU instructions),
- Its state changes over time,
- Has rules governing how it changes,
And all of this happens whether you want it to or not.
Static systems don't exist in reality, except perhaps on paper. Even a stone is quasi-static: atoms are moving, energy is circulating. So our fragile pipelines are definitely no stone monoliths.
Take a data pipeline - our daily bread. The definition is simple: a chain through which data travels from a "piece of hardware in the forest" to a "prepared dataset that no one will read, but everyone will complain about".
The source is always independent, unpredictable, and operates by its own laws. We can confidently say that data will arrive "on average in 200 ms," but reality answers: "Haha, here's 3 seconds and a batch of corrupted values on top". To somehow organize the chaos, we build architecture: we dump everything into a data lake (or at least S3), and run batch processes every N minutes. Sounds nice in words. Essentially, we're just describing the behavior of a dynamic system: data is present, data is missing, data is corrupt, data is wrong, data got offended and left.
And all around, a crowd of other dynamic neighbors lives: the operating system with its own mood; the garbage collector, which wakes up "when it feels like it"; the network, which sometimes pretends that it doesn't exist; the cache, which lives its own life; the queue, which grows, degrades, and flares up in metrics at the most convenient moment.
And at the end of this parade is tail latency. The pure result of accumulated micro-delays, fluctuations, drift, and oddities.
Does stasis exist in digital systems? Resign yourself, Mr. Developer, it does not. The system lives. Even if you desperately want it to stand still, like photographs on the wall.
The Cache: Where You Can Kill a Lot of Time
Something can go wrong at every step. Let's take the cache—our favorite accelerator, which is supposed to "store the results of repetitive computations so everyone is happy". In an ideal world, the cache behaves calmly: it keeps popular data handy, discards unpopular data, saves memory, and delights developers and accountants who look at the AWS bills.
It sounds like a song. In reality, it sounds like jazz: everyone plays their own part, and no one knows how it will end. The cache lives by access patterns. Five minutes ago, one set of keys was popular; five minutes later, another set is. Some data dropped out of circulation, and the cache evicted it. All of this is dynamics happening in real-time, not in your head.
Now, a commercial experience example:
We have a Celery Worker (part of our data pipeline). Redis serves as the queue. Celery calculates simulations and scientific statistics for 100 people working at different times of the day, each on their own tasks. There are about 30 different tasks and subtasks in total—and each has its own character.
To set up all this joy, you need to understand one simple thing: who our users are and how they load the system. Otherwise, you get a "shot in the dark" configuration. This is the case when you have extra bolts left over after assembling the closet. The closet stands, but you trust it less.
Given:
- Input data in S3 (0.5–100 MB),
- Celery performs the computations,
- Redis acts as both the queue and temporary result storage.
And now the fun begins.
Most developers (and I was one of them once) reason like this: "The TTL is this, maxmemory is that, I'll bolt on LFU, I'll keep LRU—and off we go". Then—"we'll tweak it as we go". Spoiler: as you go, you won't be fixing Redis. You'll be fixing your own nerves.
Setting up a cache without analyzing behavior is pure casino. A casino for you, for your colleagues, and for the cache itself, which lives in a continuous stress test of dynamics. While you think you've set "constants," the world changes the load, people change patterns, Celery changes its rhythm, the GC suddenly decides, "Oh well, I'll wake up now," and the cache starts working according to a completely different scheme. You are not placing the bets—the traffic is placing the bets.
Welcome to architecture as it is: dynamic, alive, disobedient, but quite amusing if you stop expecting ideal predictability from it.
When Numbers Meet Reality
Let's say the average task execution time is 6 seconds, but the scatter is from 500 ms to a sudden 26 seconds a couple of times an hour. (The numbers presented here are real, fresh from Grafana). There's a task of uploading a file to S3—100 MB, and UI/UX doesn't save you here: sometimes people upload something completely unsuitable for the task. It happens. We focus on the system.
Redis Settings:
maxmemory: 4gb
maxmemory-policy: allkeys-lru # eviction policy

# Celery Task Settings
class_1_light:
  ttl: 600s
  result_size_avg: 3kb
class_2_heavy:
  ttl: 3600s
  result_size_avg: 200kb
We omit other parameters for simplification.
Load Parameters:
| Task Class | Baseline Load | Avg Result Size | TTL |
|---|---|---|---|
| Class 1 (Light) | 50 tasks/sec | ~3 KB | 600 sec |
| Class 2 (Heavy) | 1 task/sec | ~200 KB | 3600 sec |
Here's a quickly estimated cache model. Without detailed explanations in this article, take it on faith, as they say in school.
\[\begin{aligned} \frac{dN_1}{dt} &= \lambda_1 - \frac{N_1}{TTL_1} - \frac{s_1 N_1}{M + \varepsilon_s}\,\alpha\,\max\left(0, M - C\right), \\ \frac{dN_2}{dt} &= \lambda_2 - \frac{N_2}{TTL_2} - \frac{s_2 N_2}{M + \varepsilon_s}\,\alpha\,\max\left(0, M - C\right), \\ M(t) &= s_1 N_1(t) + s_2 N_2(t) \end{aligned}\] \[\begin{aligned} N_1(t),\,N_2(t) &\;\text{— the number of light and heavy results at time } t, \\ \lambda_1,\,\lambda_2 &\;\text{— task intensities (tasks/sec)}, \\ \text{TTL}_1,\,\text{TTL}_2 &\;\text{— time-to-live for results (sec)}, \\ s_1,\,s_2 &\;\text{— average size of each result class (bytes)}, \\ C &\;\text{— memory limit for Celery results (bytes)}, \\ \alpha &\;\text{— the eviction stiffness coefficient (sec}^{-1}\text{), typically }10^7\!-\!10^8, \\ \varepsilon_s &\;\text{— a small constant (}10^3\text{–}10^6\text{ bytes) to prevent division by zero}. \end{aligned}\]If we analyze the mathematical model and plug in the numbers, the result is approximately 800 MB (20% memory load) in the cache. Everything is okay, there is buffer, the cache system is stable under the given initial parameters.
But any system must be designed with scalability margin—which I always insist on. And if there is no scalability, you need to think about it now. It's better to run the math beforehand— differential equations, nonlinear equations, simple mathematical estimates. The plan will be obsolete the moment it's written, but at least some reference point appears.
Now, trouble (for the developer): the load has quadrupled.
| Task Class | Baseline Load | Quadrupled Load | Status |
|---|---|---|---|
| Class 1 (Light) | 50 tasks/sec | 200 tasks/sec | Stable |
| Class 2 (Heavy) | 1 task/sec | 4 tasks/sec | Eviction Risk (75% memory) |
Recalculating the model—it comes out to about 3.09 GB, or 75% of memory. Slightly increase the number of heavy tasks—and Redis begins eviction. The system enters "searching for a victim to kick out" mode.
And following further analysis, the limit is approximately this:
- 200 Class 1 tasks/sec
- 5.3 Class 2 tasks/sec—and that's it; instability begins beyond this.
Stability Warning: Beyond \(200\) light tasks/sec and \(5.3\) heavy tasks/sec (\(\lambda_2 > 5.3\)), the cache enters a thrashing mode. Memory is fully saturated, leading to constant evictions where Redis spends more time evicting keys than serving hits.
One or two additional heavy tasks—and the cache turns into a hunter running through memory with the question: "Whom should I delete to remain useful?".
Conclusion: A Few Model Portraits and a Lot of Common Sense
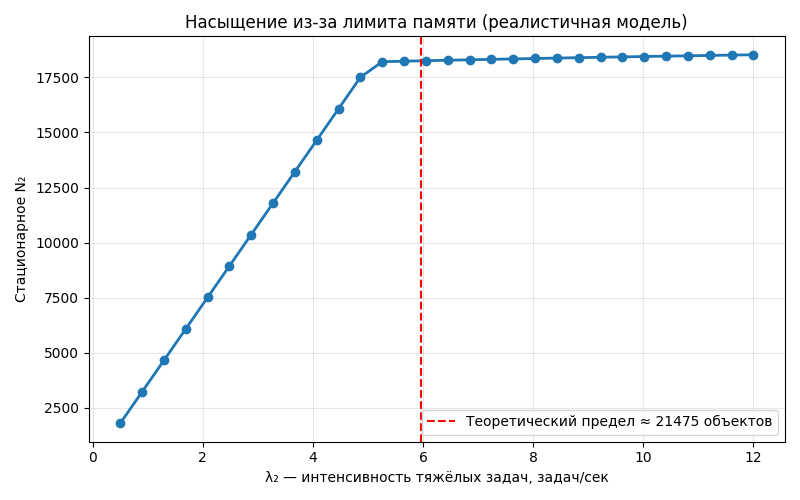
It's logical to conclude all this with illustrative graphs from dynamic systems theory that show the stability limit. How the final stationary number of heavy results changes as the load increases:
- At \(\lambda_2 \in \{1,\dots,4\}\) → the growth is almost linear.
- At \(\lambda_2 \approx 4,\dots,6\) → the system enters the memory saturation zone.
- At \(\lambda_2 > 6\) → Redis enters the mode of constant evictions; the growth of \(N_2\) slows down almost to zero → thrashing mode.
The number \(N_2\) answers the question: "How many heavy results will, on average, reside in Redis at a given heavy task intensity \(\lambda_2\) once the system has stabilized?" The answer: close to 20–21 thousand.
New parameters (TTL, load, result size, memory) do not immediately appear in the metrics but after a couple of TTLs. This means after changing the configuration, you must wait several TTLs, before evaluating the effect.
Yes, it has little to do with precise reality. Yes, there are a lot of caveats. But this is already a way to at least slightly tame the digital chaos. Systems live. They are not static. They flow, change, drift, get tired, behave strangely, sometimes delight, sometimes bite. And our job is not to try to force them to stand still, like photographs on the wall.
Our job is to understand that they are dynamic and to factor that into every architectural, engineering, and operational detail.
That's all for now. Beyond this—only practice, monitoring, and cautious optimism.